Canada and the United States share a border and a long list of employers. Amazon, Google, Microsoft, Citi and the big Canadian banks hire engineers on both sides of it. So we asked the job ads a simple question: when the same employer advertises the same job at the same level in both countries, what changes?
Mettlespark reads tech job ads every day from employers' own career pages and public job boards across both countries, and merges reposts and copies so each job counts once. This piece uses the 54,085 ads first posted between 15 May and 11 November 2026: 49,982 in the United States and 4,103 in Canada. It compares what the ads say. It does not compare how many there are: our sources cover the two countries differently, so a count of ads is not a measure of either market's size.
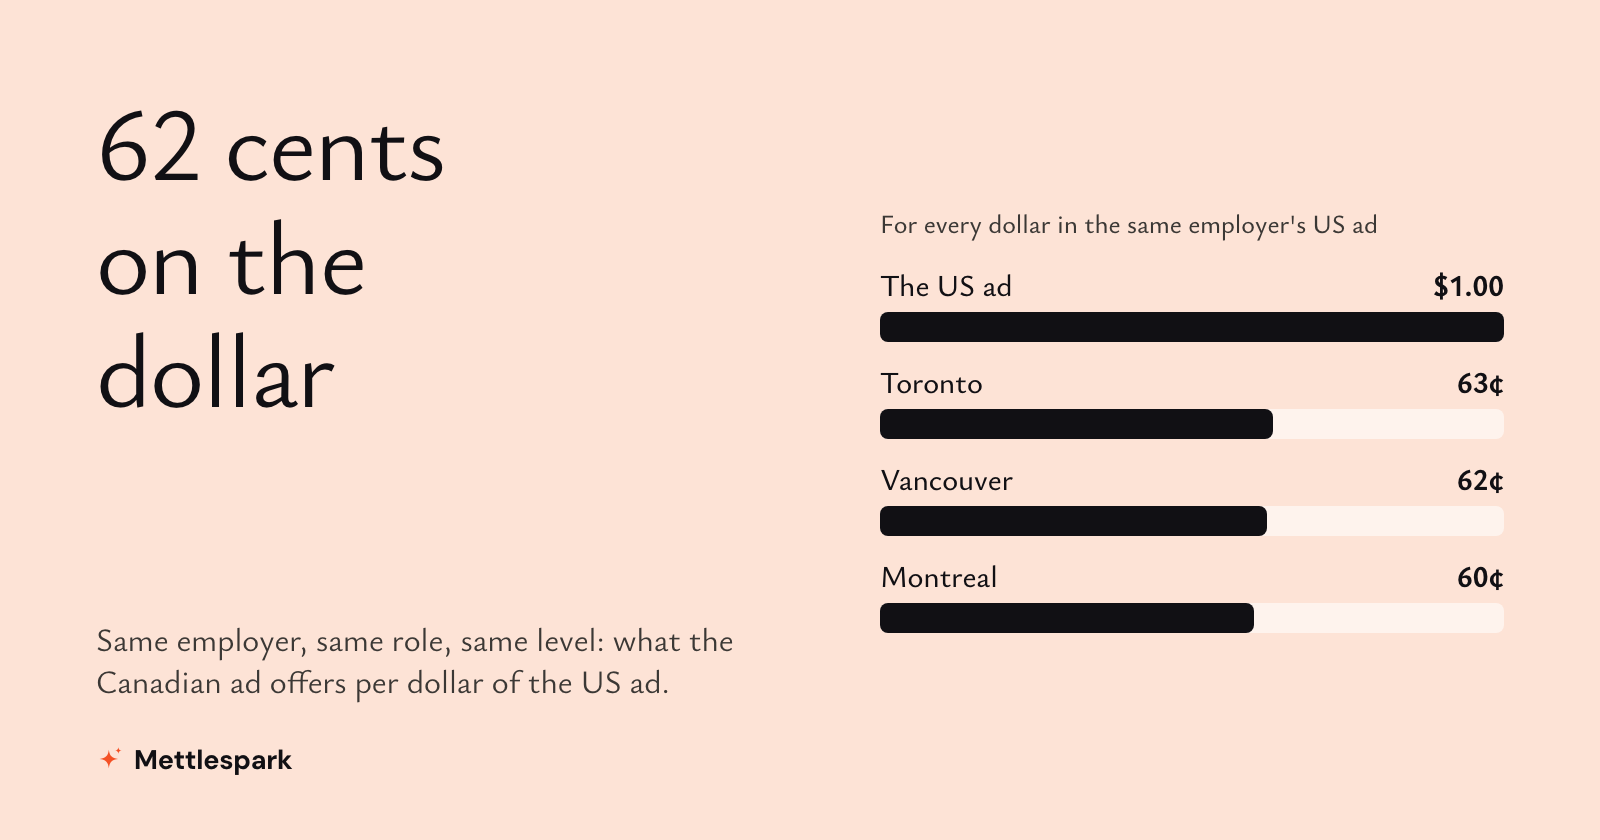
1. The same job is advertised at 62 cents on the dollar
Two in three Canadian tech ads (67%) come from employers that also advertise in the United States: 479 of the 799 employers we saw in Canada post on both sides. That makes a clean comparison possible. We took every employer that stated pay for the same role at the same level in both countries, 414 pairs from 153 employers, covering 932 Canadian ads and 4,078 US ads, and compared the midpoints of the ranges they printed, with Canadian dollars converted at the Bank of Canada's average rate over the period (1.4013 to the US dollar).
The Canadian ad offered a median of 62 US cents for every dollar in the US ad. It offered more in 2 of the 414 pairs. Among the 128 pairs with at least two ads on each side, it offered more in none.
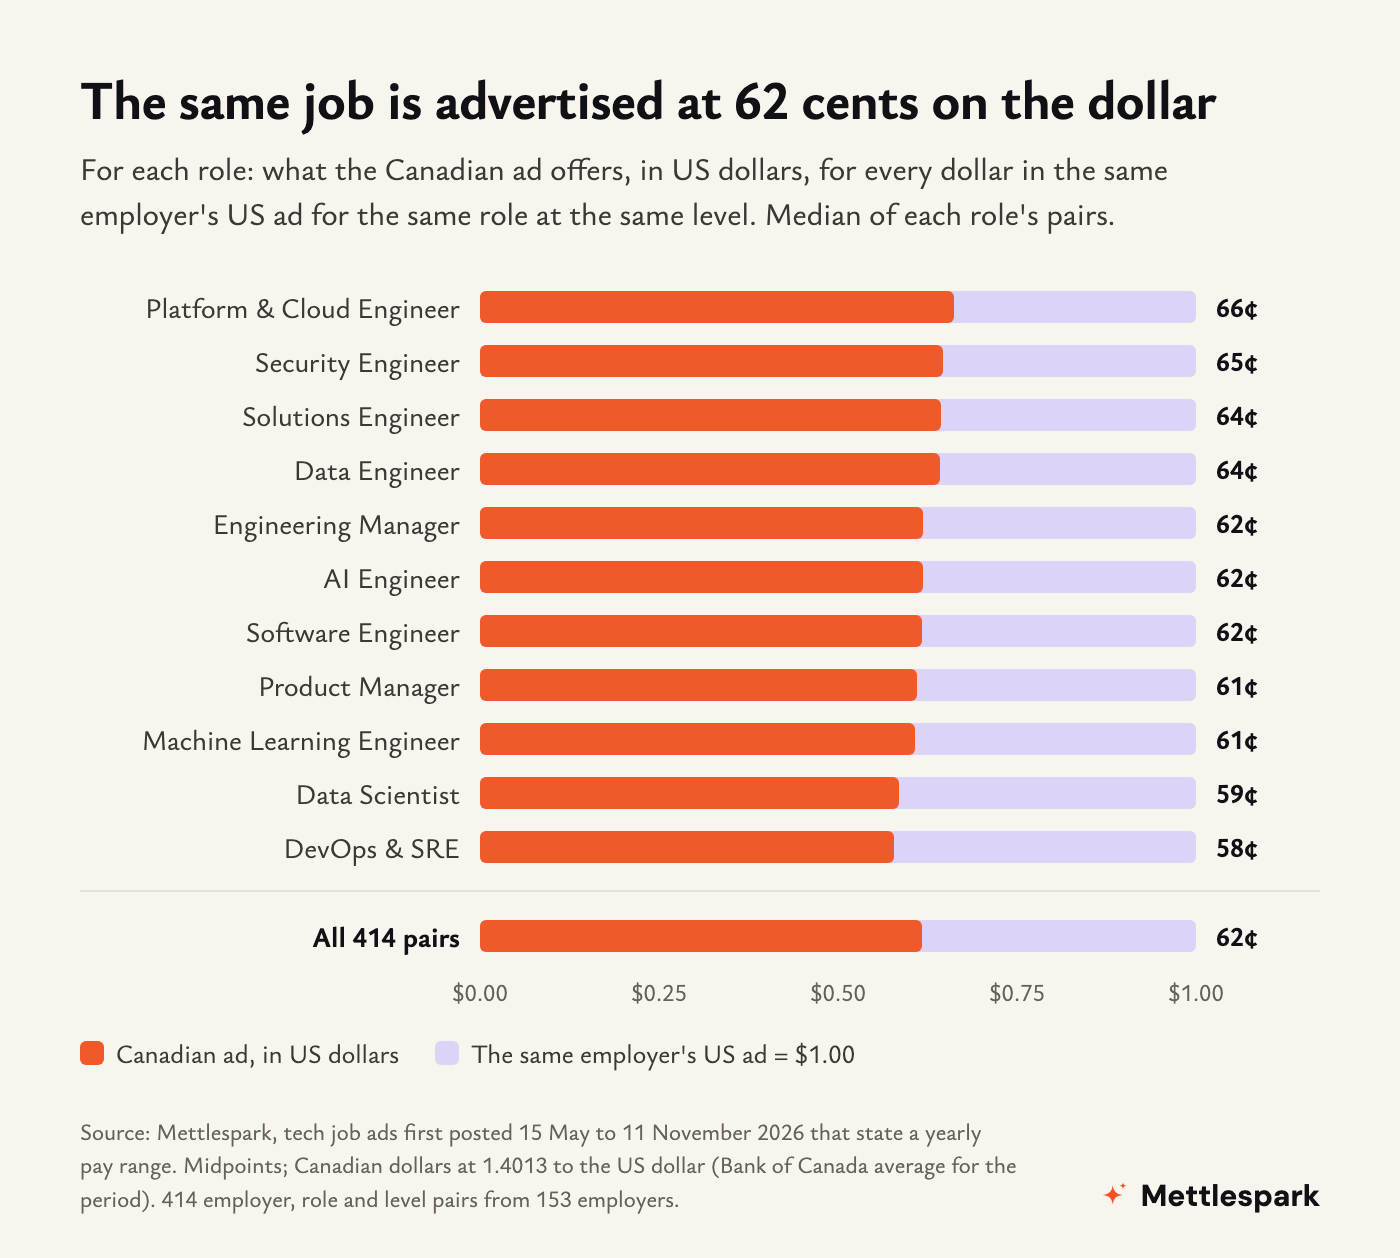
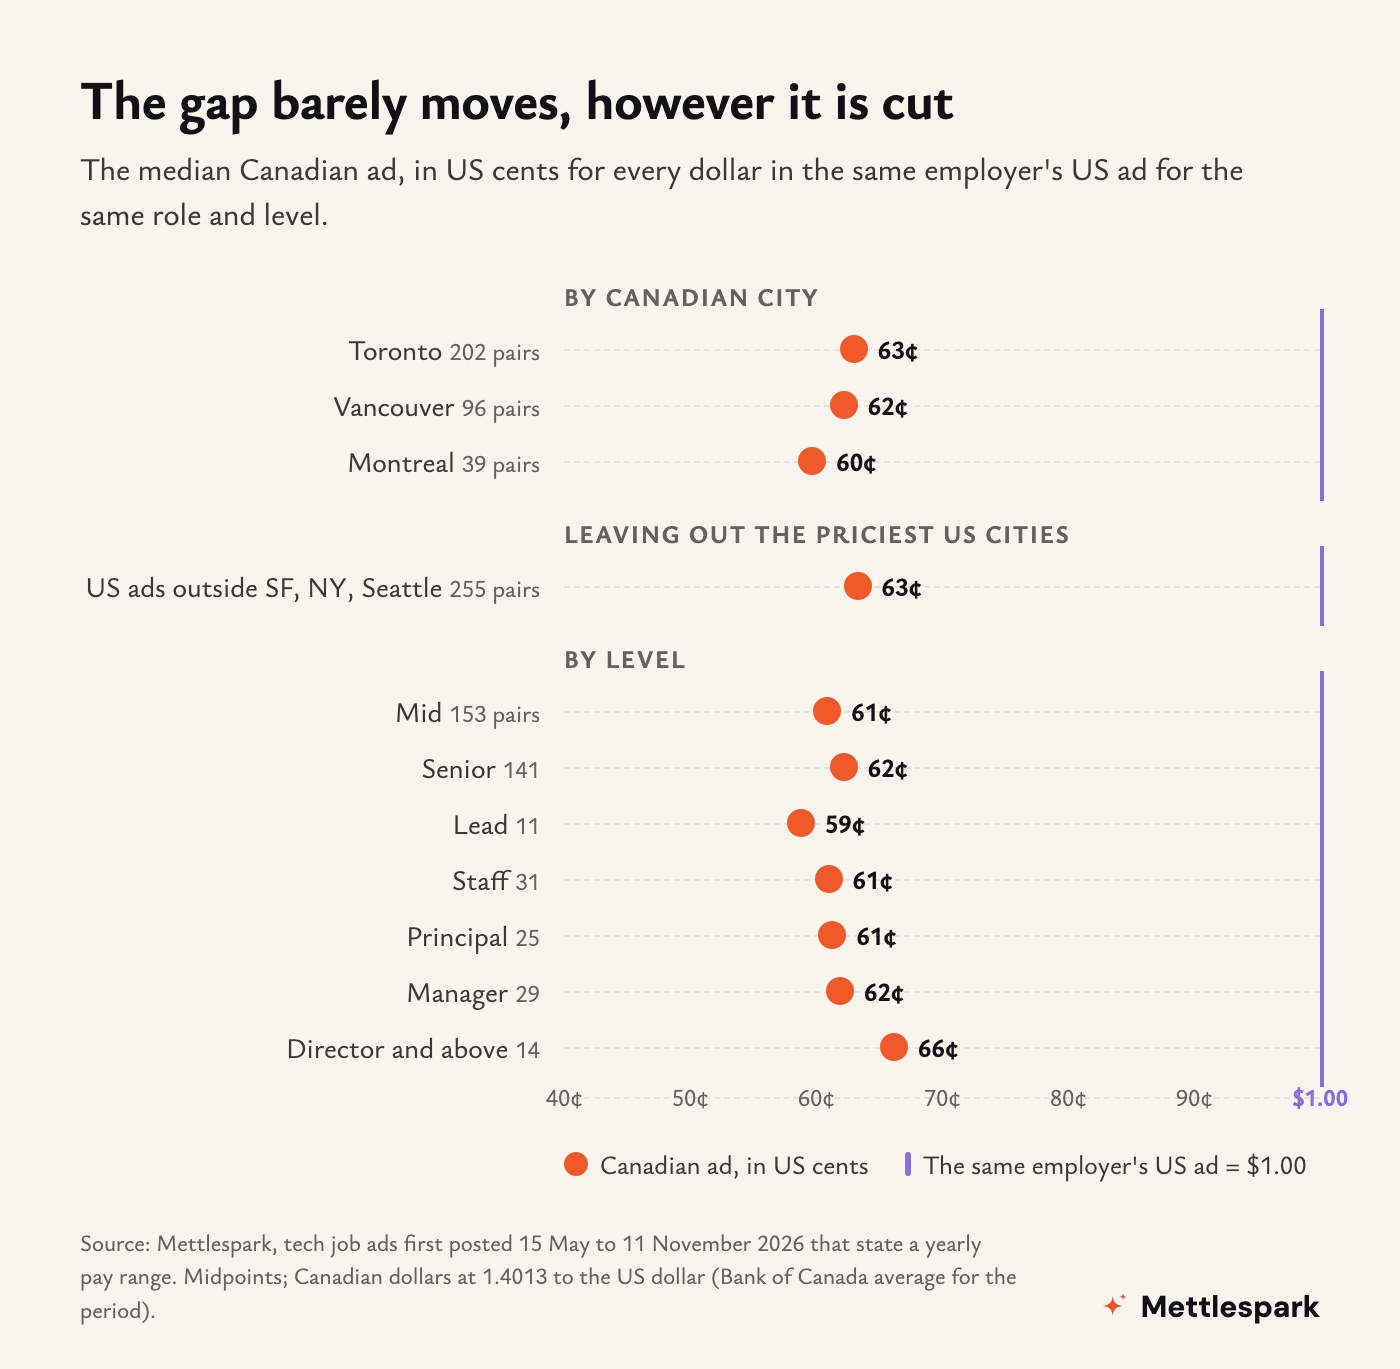
The gap is the same almost everywhere we cut it. By role it runs from 58 cents (DevOps and SRE) to 66 cents (Platform and Cloud Engineer). By level, from 59 cents for leads to 66 cents for directors. By city, Toronto 63 cents, Vancouver 62, Montreal 60. San Francisco does not explain it either: against US ads outside the Bay Area, New York and Seattle, leaving out remote ads, the Canadian ad still offers 63 cents.
In dollars: matched to the same employer's US ad, the median senior software engineer ad in Canada offers C$151,500, about US$108,100. The US ad offers US$178,300. The Canadian figure is smaller even before the exchange rate: C$86 for every US$100.
Among the employers with the most Canadian ads in these pairs, the ratio sits in a narrow band:
| Employer | Canadian ads matched | Canadian ad, per US dollar |
|---|---|---|
| Amazon | 150 | 71 cents |
| CGI | 58 | 62 cents |
| Citi | 45 | 63 cents |
| Lyft | 43 | 60 cents |
| Okta | 31 | 61 cents |
| BMO | 27 | 53 cents |
| 27 | 62 cents | |
| TD Bank | 26 | 71 cents |
| Microsoft | 21 | 60 cents |
| Workday | 21 | 61 cents |
These are the ranges employers print, not what anyone is paid. A range is not the whole package either: equity, bonuses, benefits, taxes and the cost of living all differ. But holding the employer, the role and the level fixed is as close to like for like as public data gets, and it leaves a gap of about 38%.
2. Remote work rarely crosses the border
For a Canadian, a remote US job looks like the way around that gap. The ads say it seldom is. Of 11,750 remote tech ads in the United States, 963 (8%) name Canada among the places the hire can live. The other 92% name only the United States.
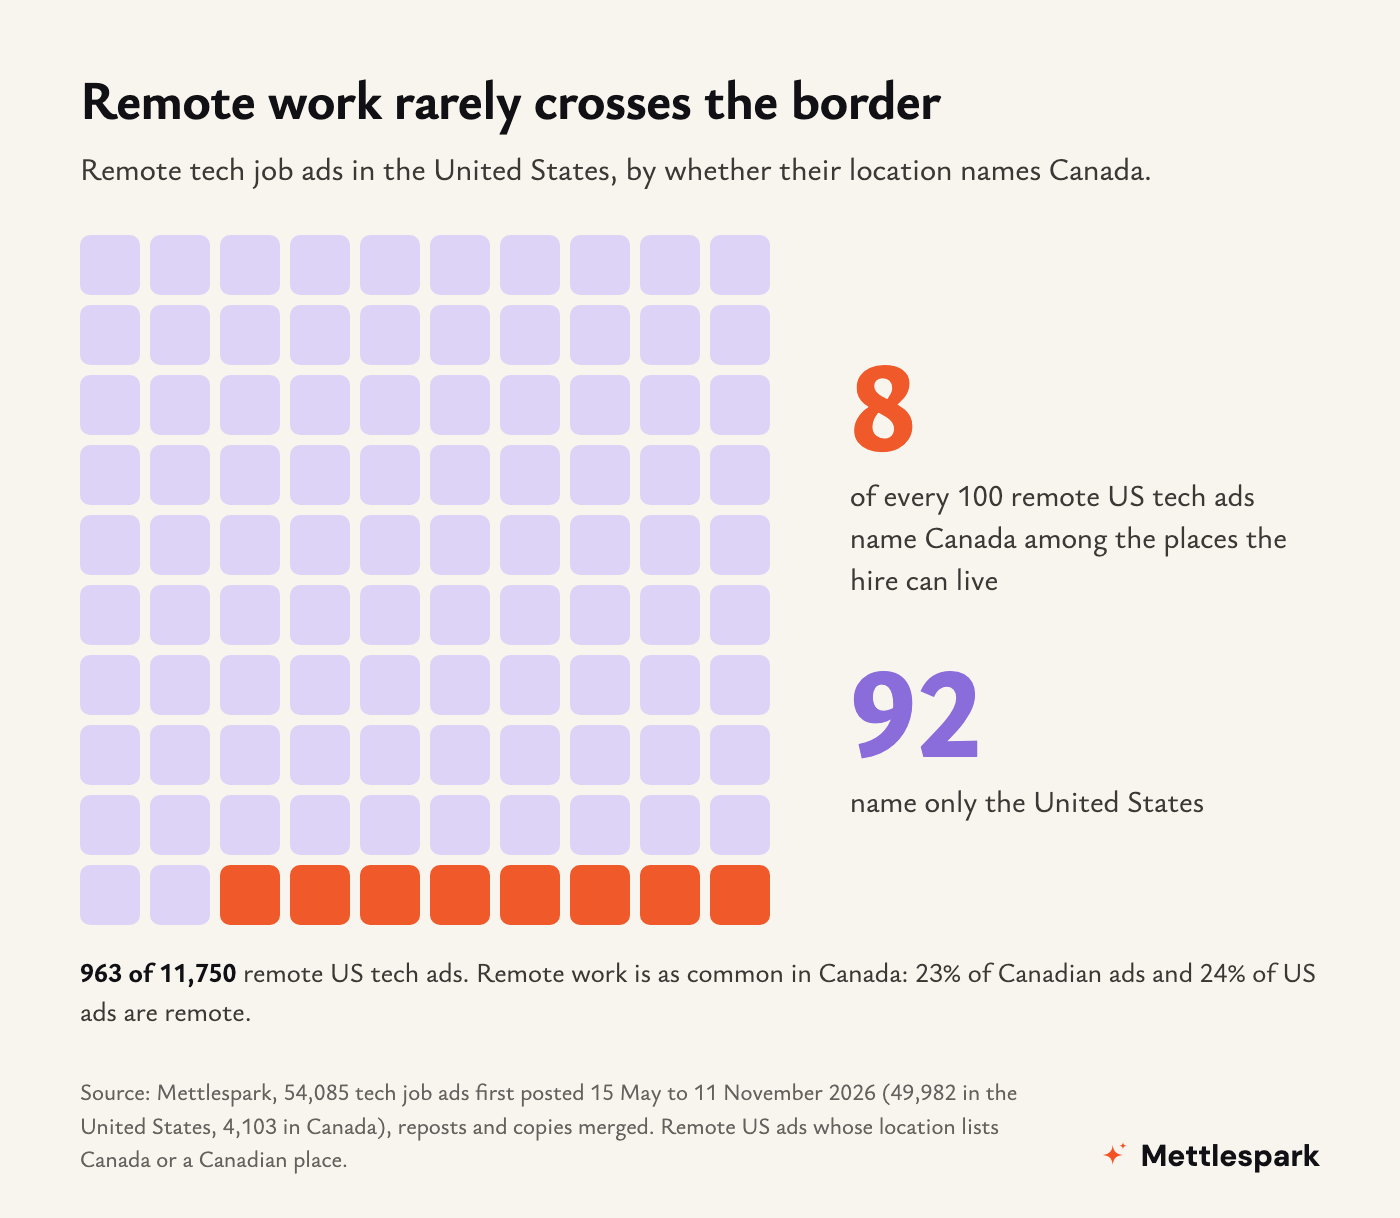
Remote work itself is as common in Canada as in the US: 23% of Canadian ads and 24% of US ads are remote.
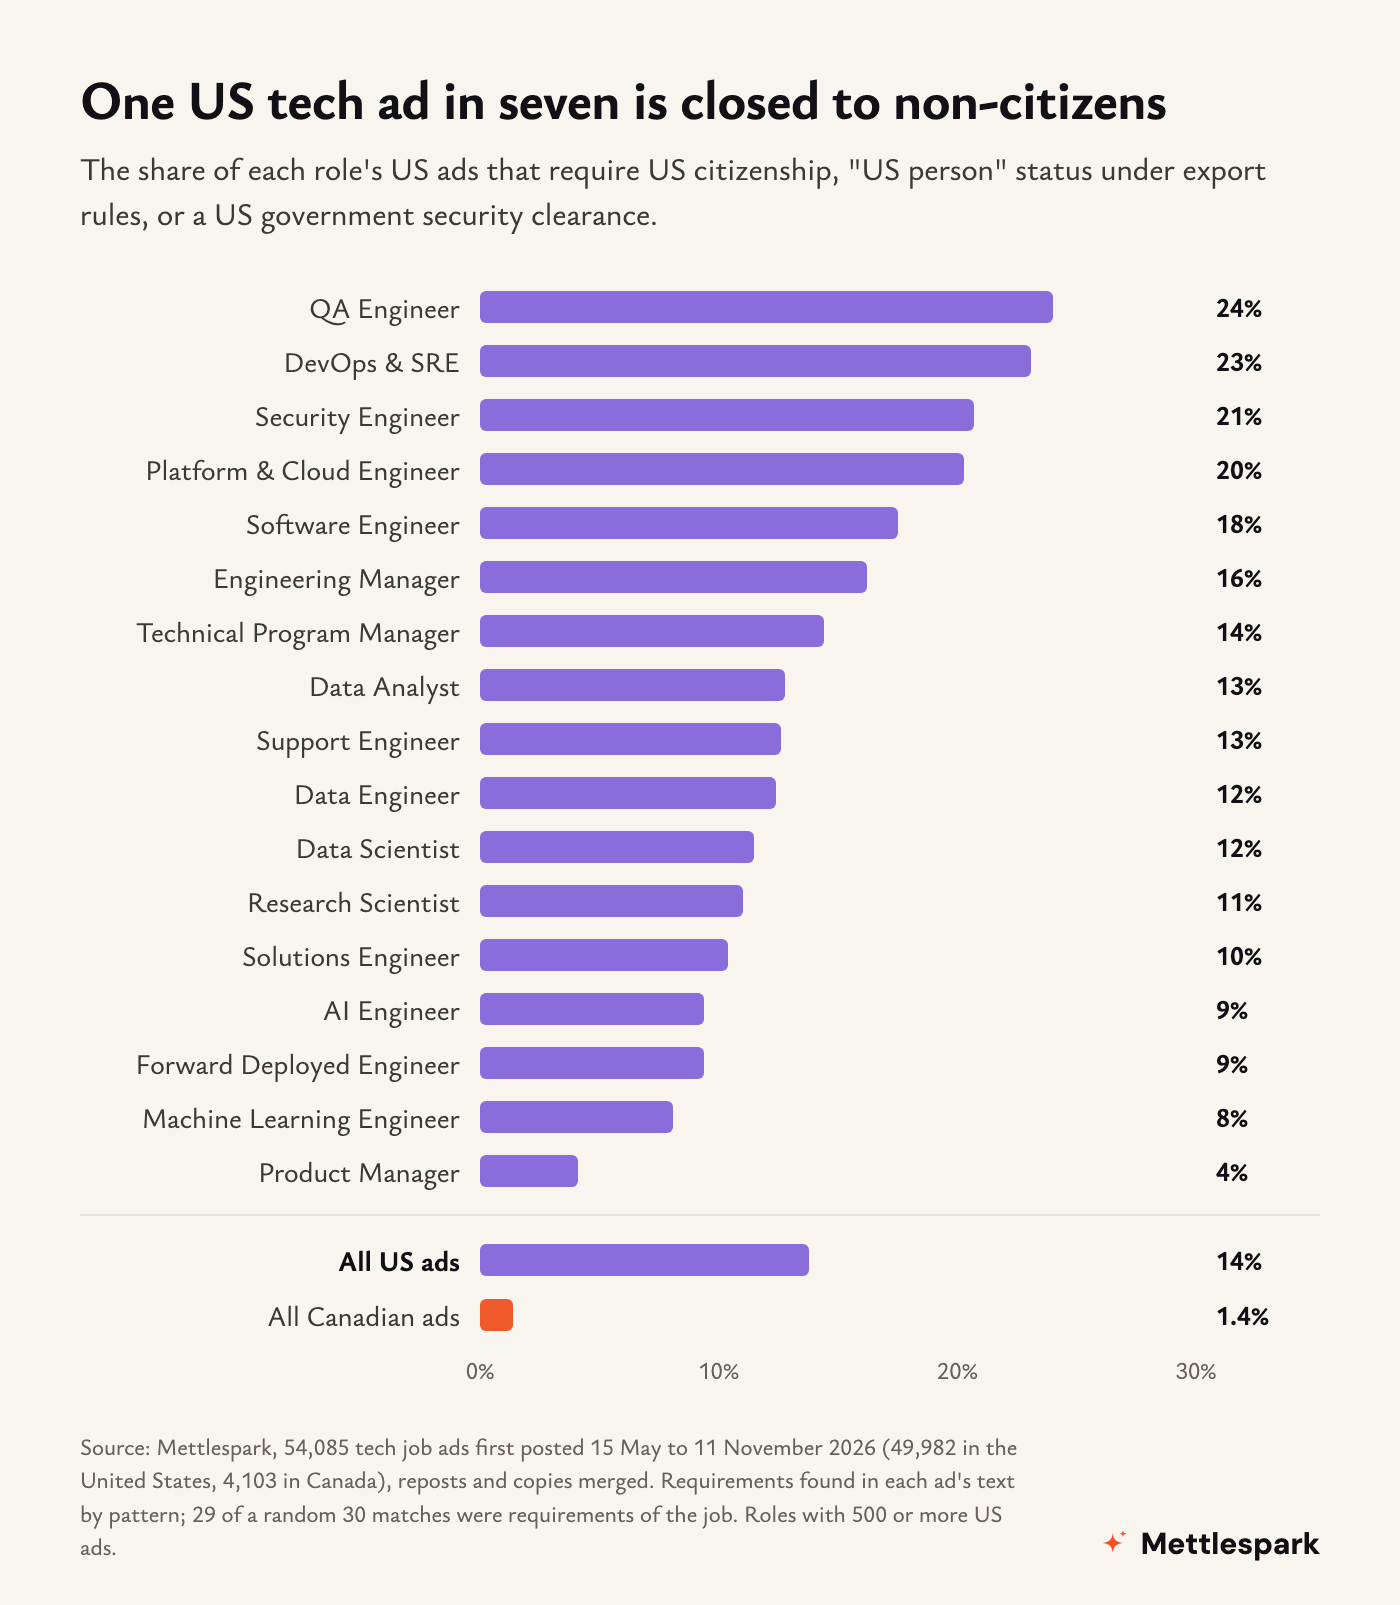
3. One US tech ad in seven is closed to non-citizens
6,899 of the 49,982 US ads (14%) require US citizenship, "US person" status under export rules (a citizen, green card holder or refugee), or a US government security clearance, which in practice means a citizen. In Canada the equivalent figure is 1.4%.
It is not spread evenly. Nearly a quarter of US QA Engineer and DevOps and SRE ads are closed this way, a fifth of Security and Platform and Cloud ads, and 18% of Software Engineer ads. Product Manager ads are the most open, at 4%.
The reason is defence. Aerospace and defence employers post 12% of US tech ads and 2.5% of Canadian ones, and government employers 3.3% against 1.3%. Remote work is the most open part of the US market by this measure, with 6.6% of remote ads closed this way, but as section 2 shows, 92% of remote ads name only the United States.
4. Canada's tech jobs run through five banks
Banking and financial services post 20% of Canadian tech ads, twice the US share of 10%. Five banks alone, RBC, BMO, Scotiabank, TD and CIBC, posted 446 of the 4,103 Canadian ads: one in nine. Five large US banks (JPMorgan Chase, Bank of America, Citi, Wells Fargo and Capital One) posted about one in forty US ads. After Amazon, the three employers with the most Canadian tech ads are RBC, BMO and Scotiabank.
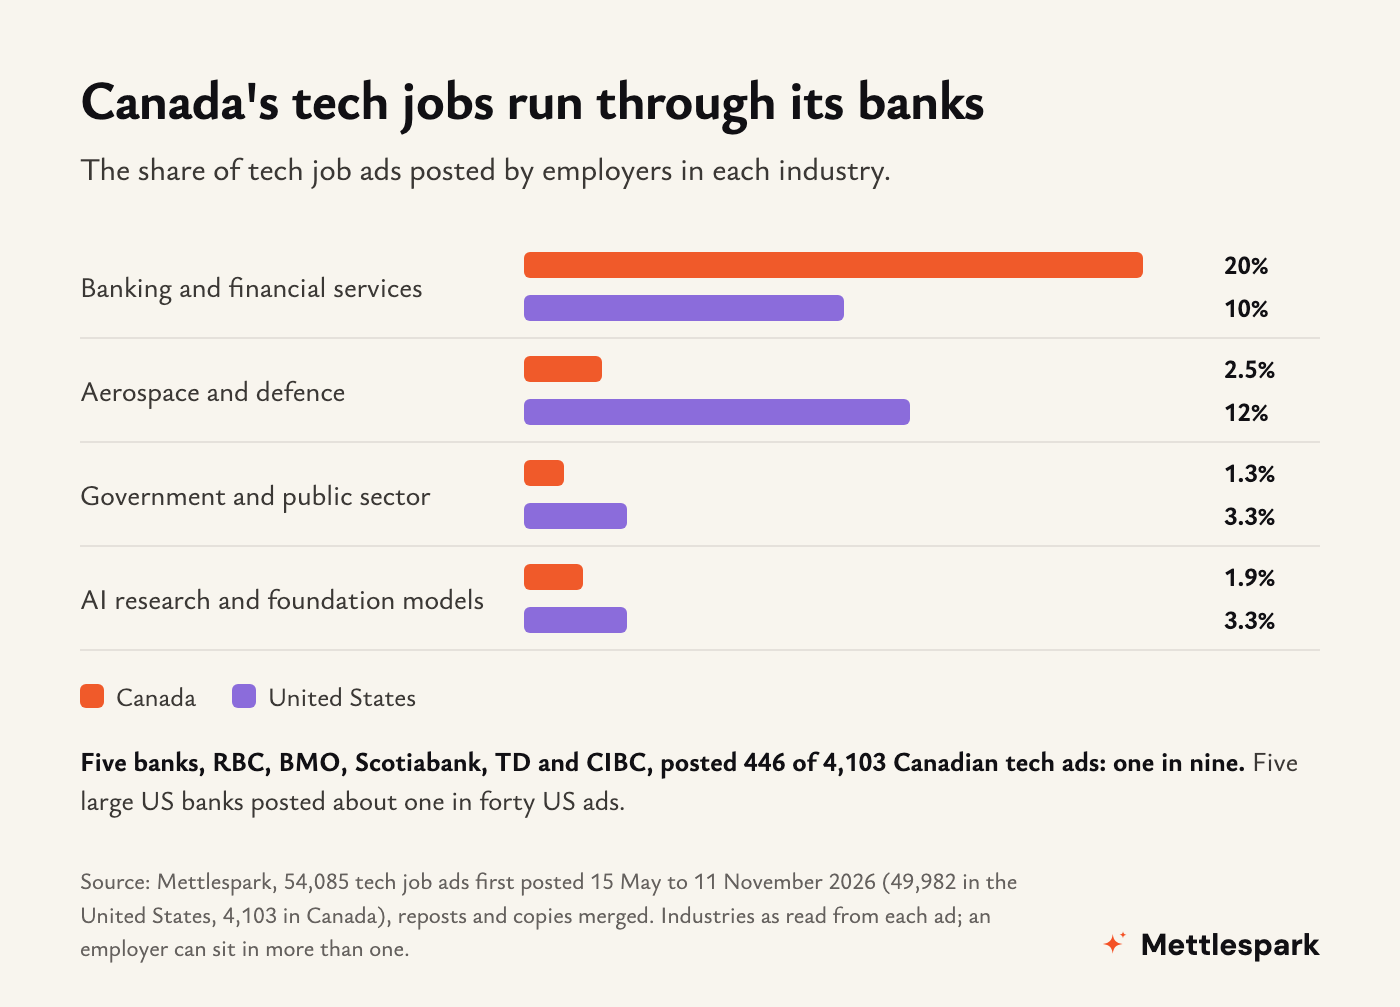
For a Canadian engineer, the biggest local employer is far more likely to be a bank than a product company or a lab. The stacks differ too: Azure appears in 24% of Canadian ads against 17% of US ads, the widest gap among the cloud platforms.
5. The top of the ladder is in the United States
Staff and principal roles, the technical ranks above senior, are 15% of US tech ads and 10% of Canadian ones. Research Scientist ads are 2.4% of US ads and 0.6% of Canadian ones, a quarter of the share. 11% of US ads require a PhD; 5% of Canadian ads do.
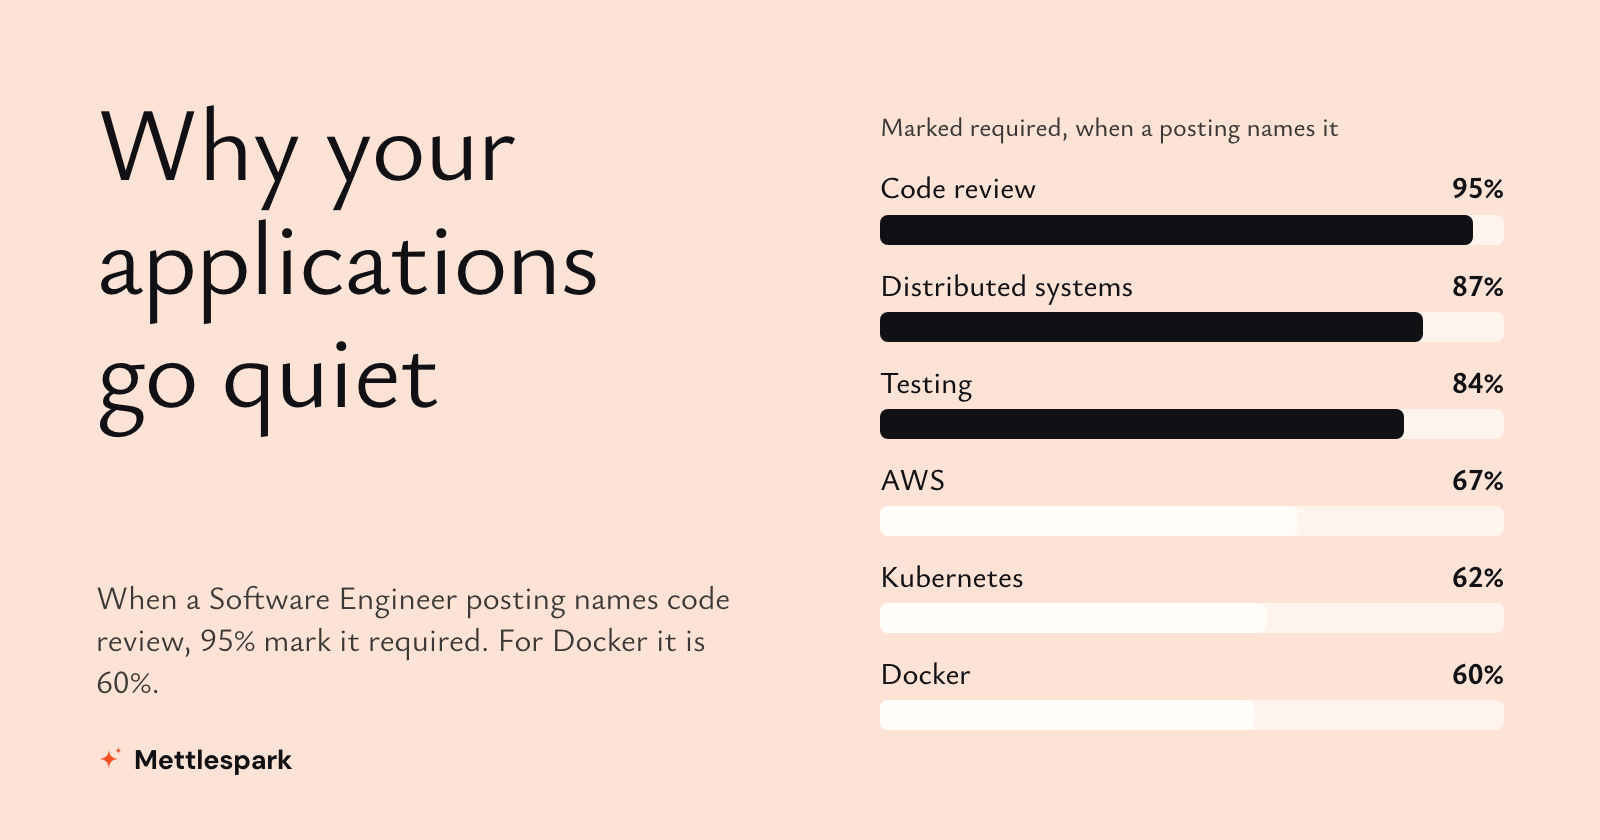
The skills follow the same line. In Software Engineer ads, C++ appears in 28% of US ads and 20% of Canadian ones, and Rust in 8.5% against 3.8%. Canadian software ads ask more often for the everyday work of shipping: code review in 44% against 34%, React and TypeScript in 29% against 22%.
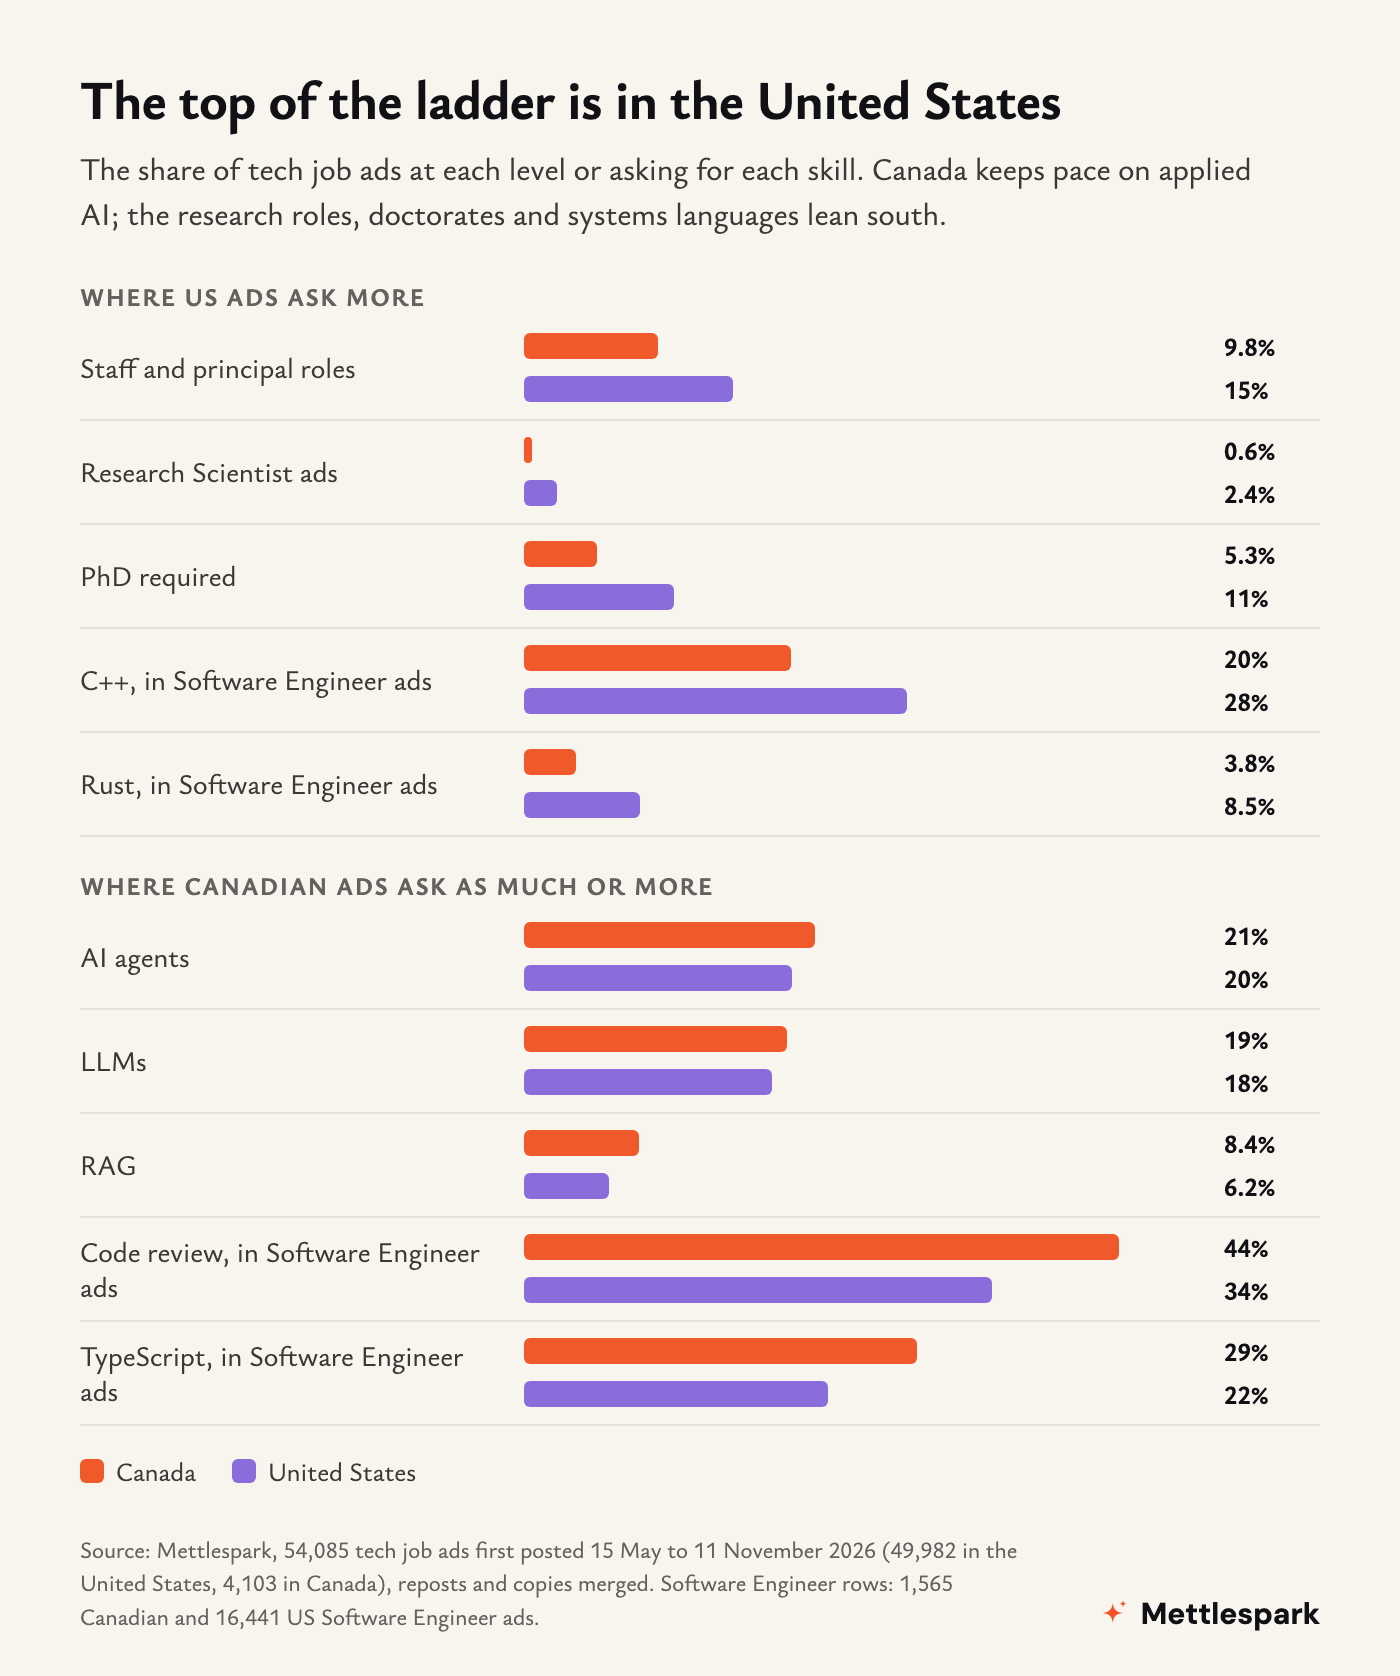
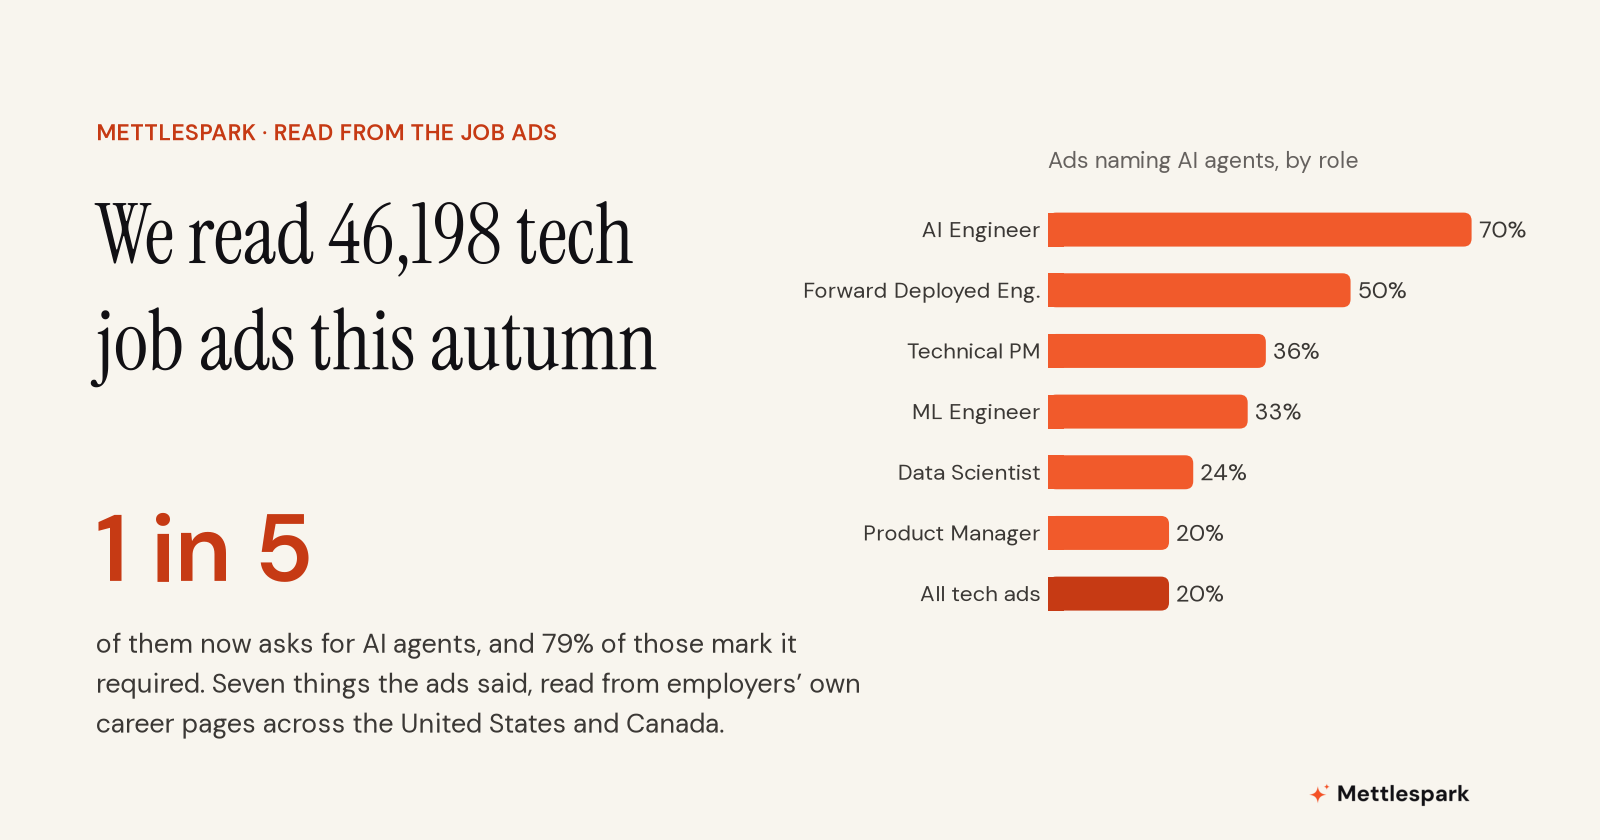
Canada keeps pace on applied AI. Canadian ads ask for AI agents (21% against 20%), LLMs (19% against 18%) and retrieval-augmented generation (8% against 6%) at least as often as US ads. The gap is in who builds the models: the research roles, the doctorates and the systems languages sit south of the border.
6. Ads show pay where the law requires it
63% of Canadian tech ads state pay, against 69% of US ads. The spread inside each country is wider than the gap between them, and it lines up with the law.
British Columbia has required pay in job ads since November 2023: 76% of its tech ads show it. Ontario's rule took effect on 1 January 2026 for employers with 25 or more staff, with jobs paying over $200,000 exempt: 67%. Alberta and Quebec have no such rule: 43% and 33%. Quebec's tech ads state pay less often than those of any state or province with 300 or more ads in our data. It is not a quirk of reading French: in Quebec, French-language ads state pay more often than English ones, 45% against 31%.
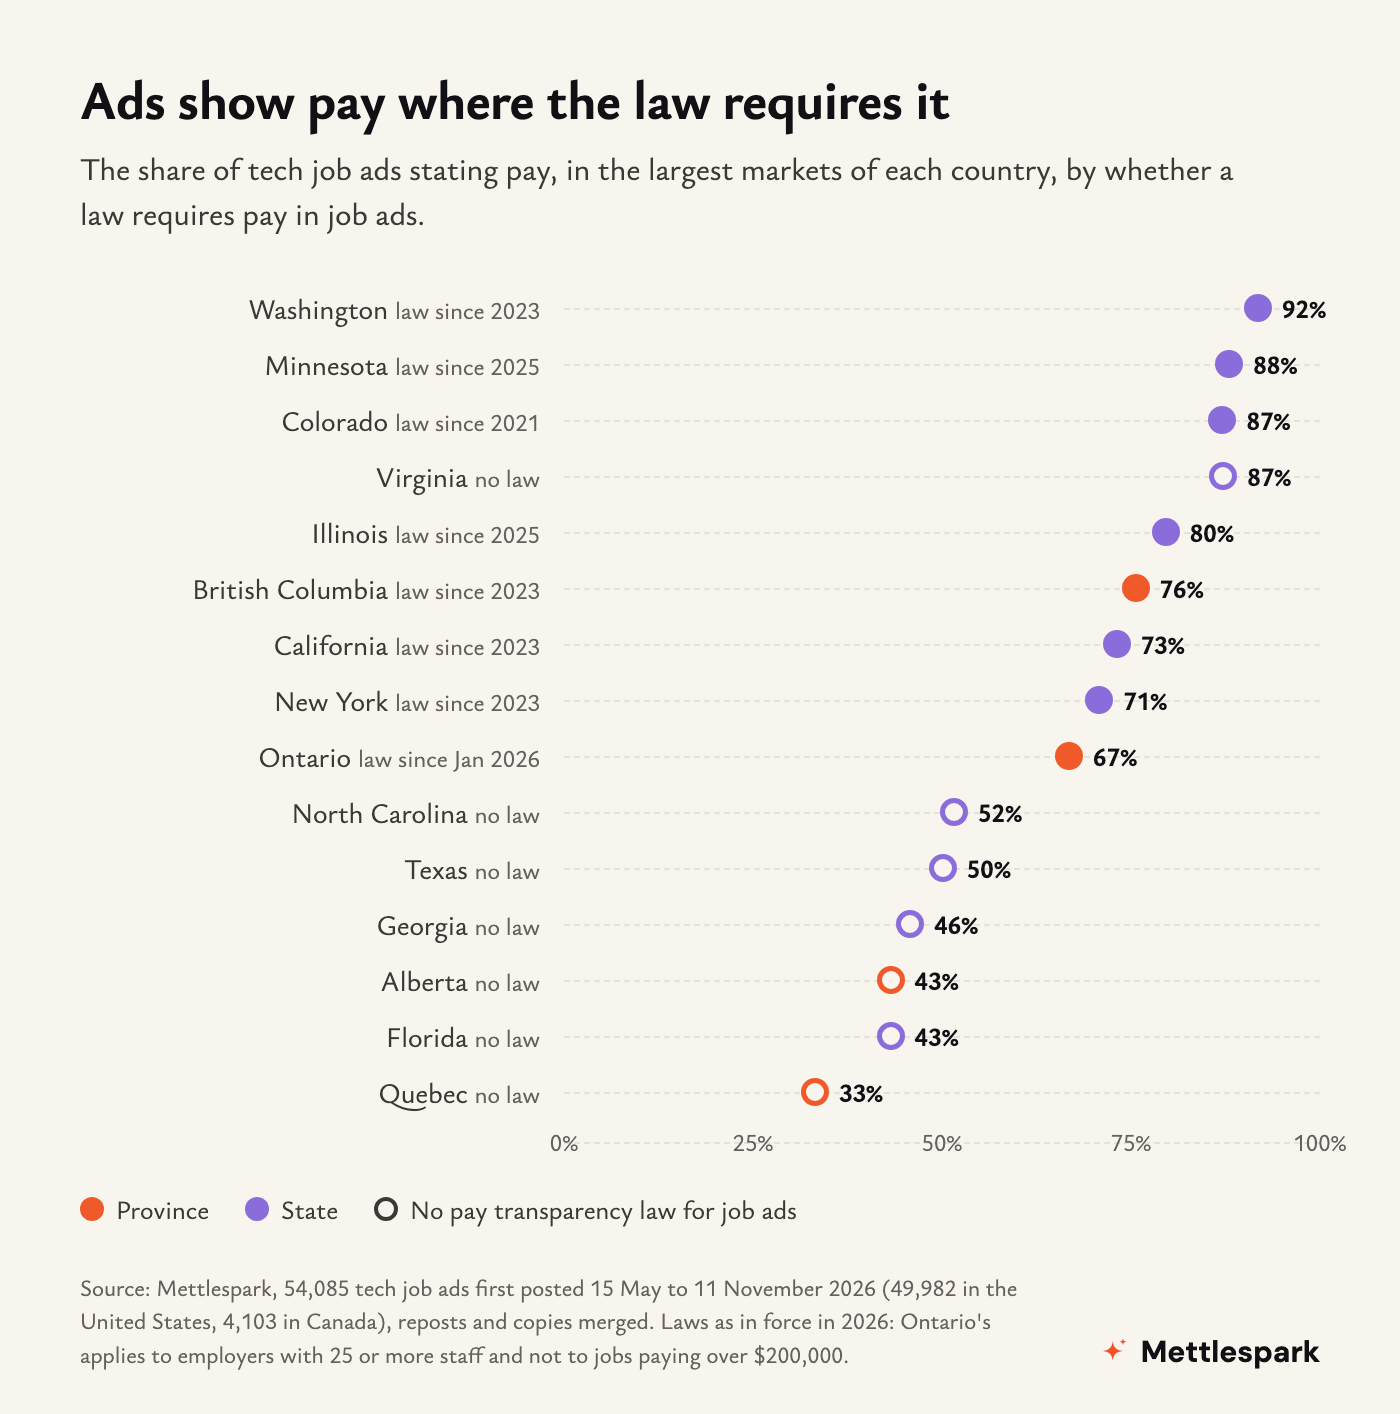
The US shows the same split. Washington (92%), Minnesota (88%), Colorado (87%), Illinois (80%), California (73%) and New York (71%) have laws; Texas (50%), Georgia (46%) and Florida (43%) do not. Virginia is the exception, at 87% with no state law; its largest tech advertisers are federal contractors and Capital One.
7. Canada works hybrid; the US works on site
Among ads that say how the work is arranged, 47% of Canadian ads are hybrid against 31% of US ads, and 43% of US ads are fully on site against 26% of Canadian ones. Remote is the same in both, about a quarter. And one Canadian tech ad in eleven asks for French: 55% in Quebec and 5% elsewhere.
What this means
If you work in Canada for an employer that also hires in the US, its US ad for your role and level is often public, and in most large US states it has to state a range. That is the most specific number you can bring to a pay conversation.
If you are applying to remote US jobs from Canada, read the location line first: 92 of every 100 remote US ads name only the United States. Filtering for ads that name Canada saves most of the applications that would go unanswered.
If you are aiming for staff, principal or research roles, the Canadian market has fewer of them in proportion, and they ask for the systems languages and research depth that US ads ask for more often.
Every role and skill page shows the same figures for one role or skill, and the method is one page. Mettlespark reads your CV the same way it reads the ads, against the job ads in the country and places you choose, and turns the gap into a plan. It is free in early access.
How we counted
- The ads: 54,085 tech job ads first posted between 15 May and 11 November 2026, 49,982 in the United States and 4,103 in Canada, from employers' career pages and public job boards, with reposts and copies merged into one ad. Each ad's country is where the job is, or for a remote job, the country it names. Role, level, industry and skills are read from the ad's title and text, by rules and by Mettlespark AI.
- Pay: only ads that state a yearly range, in their own country's currency (2,544 Canadian ads in Canadian dollars and 34,537 US ads in US dollars), using the midpoint of each range. Advertised pay is what employers print, not what anyone is paid, and ads that state pay are not a random sample of all ads.
- Matched pairs: an employer, a role and a level with at least one ad stating pay in each country; each side is the median of its ads, and the pair's figure is the Canadian median, in US dollars, over the US median. The 62 cents is the median of the 414 pairs (the middle half runs from 56 to 69 cents). Canadian dollars are converted at 1.4013 to the US dollar, the Bank of Canada's daily average from 15 May to 10 November 2026.
- Closed to non-citizens: an ad whose text requires US citizenship, US person status or a US security clearance, found by pattern; in a random sample of 30 matches, 29 were requirements of the job.
- Remote and Canada: a remote US ad "names Canada" when its location lists Canada or a Canadian place; the rest list only US places.
- Pay transparency: the share of each state's or province's ads that state any pay, against whether a law requiring it was in force in 2026. A law is not the only reason an employer shows pay, and the comparison does not prove the law caused it.